Understanding Scale in Raised Relief 3D Maps
Creating raised relief 3D maps involves balancing accuracy with visual representation. Our maps aim to provide the customer a better understanding of geographical features, which often requires the use of vertical exaggeration.
In this post, we’ll explore the reasons behind vertical exaggeration, how it affects the perception of terrain, and the process of determining the appropriate scale for our maps.
Why Do We Use Vertical Exaggeration?
The Human Perspective on Terrain
When considering the Earth’s large size, the elevation changes across its surface seem insignificant. If we were to scale down the Earth to the size of a pool ball without vertical exaggeration, its surface would feel like fine sandpaper or even smoother. Such subtle variations wouldn’t resonate with our perception of significant geological features, like mountains and valleys.
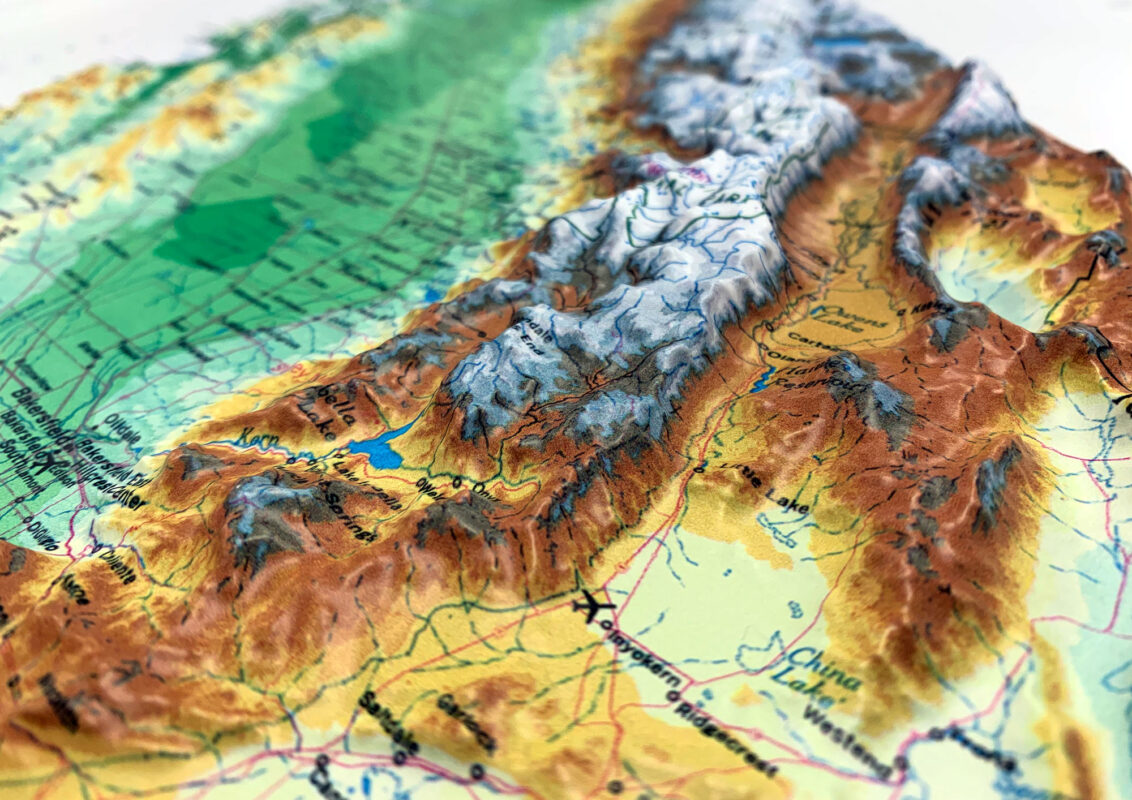
Cartographers must account for this human perspective. For instance, when we view the Himalayas, we don’t see them as small or insignificant. Our raised relief maps need to reflect this sense of grandeur and scale. This is why we exaggerate vertical elevations. Please note: even though we’re exaggerating elevations – the scale remains accurate (see more in the section below, “Horizontal vs Vertical Scale”).
Making Maps Interesting and Informative
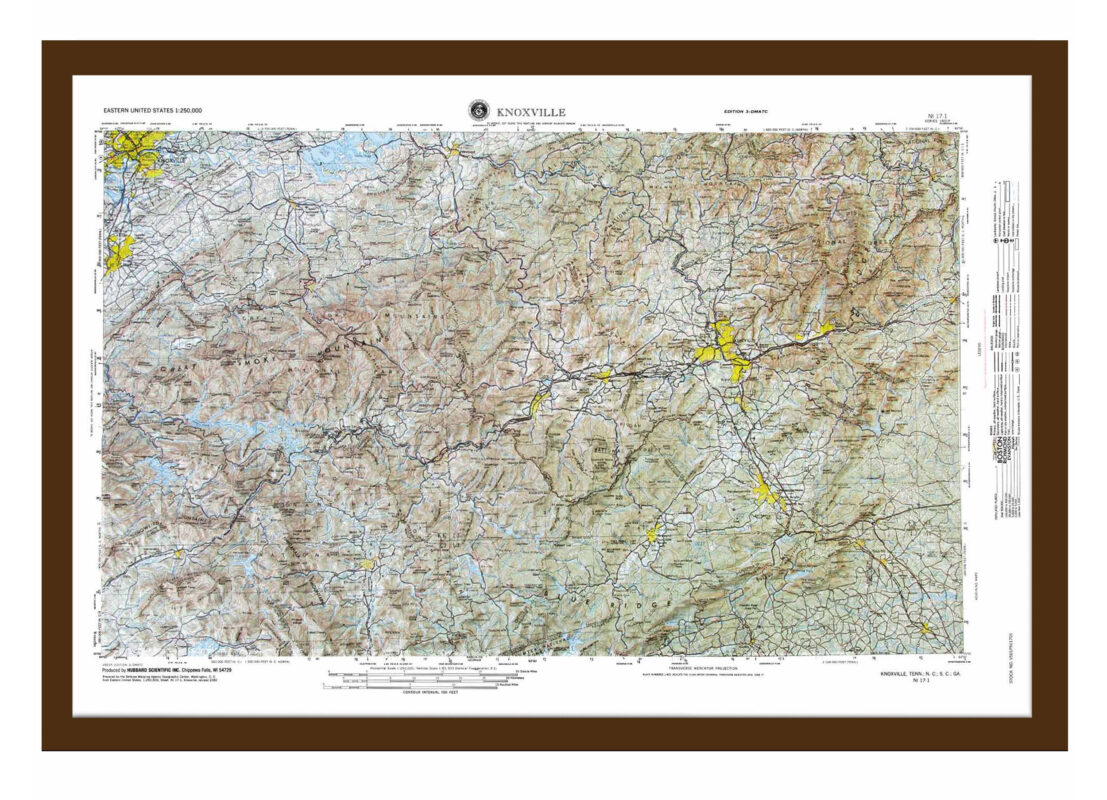
Even for smaller regions like cities, vertical exaggeration is crucial. Take our USGS Knoxville Quad map, for example. With a true 1:1 elevation scale, the map would only be around 1/4 inch tall, despite covering an elevation range of over 5,700 feet. Such minimal relief wouldn’t convey the topography effectively. By applying a 3:1 vertical exaggeration, the map stands at around 13/16 inch tall, offering a more engaging and informative depiction.
Without vertical exaggeration, maps of mountainous regions like the Blue Ridge and Smoky Mountains would appear flat and uninteresting, failing to communicate the relative elevations and rugged terrain effectively.
Horizontal vs. Vertical Scale
Horizontal Scale
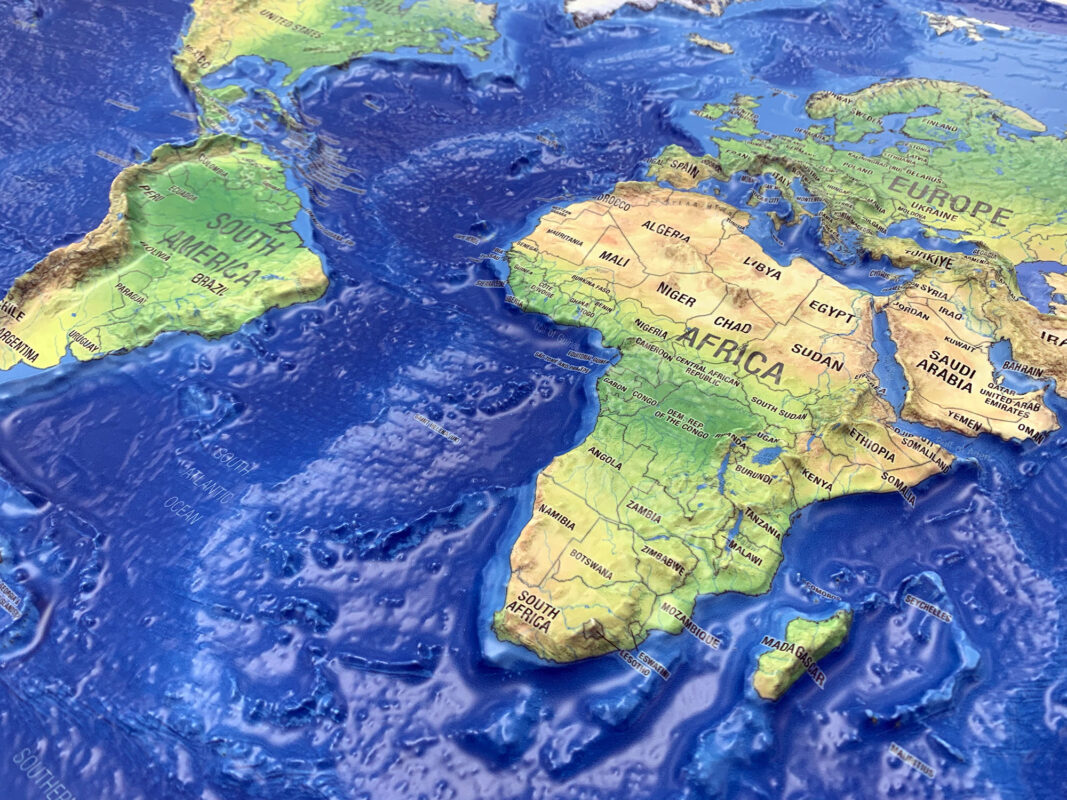
On any map, horizontal scale reduces real-world distances to fit within the dimensions of the map. For instance, our World Ranger map has a horizontal scale of 1:50,000,000, meaning 1 inch on the map represents 50,000,000 inches, or roughly 789 miles, in the real world. It’s important to note that on projections like the Miller projection, this scale is only accurate at the equator due to map distortions that occur as you move towards the poles.
Vertical Scale
Conversely, the vertical scale on a raised relief map increases distances to emphasize elevation changes. For land areas on the World Ranger map, the vertical scale is about 1:720,000, where 1 inch of relief equates to 720,000 inches (60,000 feet) of elevation. Mount Everest, for example, appears as about half an inch above sea level.
Why Scales Differ
The horizontal and vertical scales vary because of the different decisions our cartographers make based on the physical size of the area and the elevation within the area.
Horizontal scale is chosen based on the size of the area being represented and the available space on the map. For instance, the Knoxville map’s dimensions of 28.5 inches wide by 17.5 inches tall cover an area of approximately 100 miles by 70 miles, resulting in a horizontal scale of 1:250,000.
Vertical scale, on the other hand, is chosen based on the desired height of the relief and the range of elevation changes. These factors are independent of those affecting the horizontal scale. The three main considerations for vertical scale include the thickness of the material used, the tolerance of the print when forming dramatic elevation changes, and the cartographic judgment of how to best represent the geography and topography.
Case Study: Our Knoxville Map
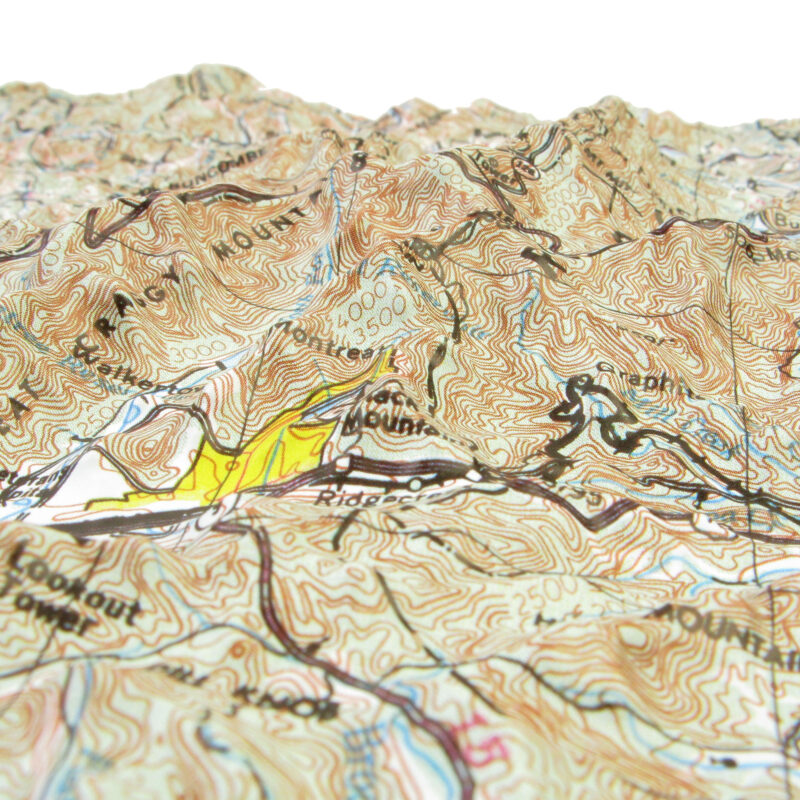
To illustrate these concepts, let’s delve into the creation of the Knoxville map. The map covers an elevation gain of 5,746 feet, and the desired height for the relief was around 13/16 inch. This decision led to a vertical scale of approximately 1:83,333.
Given the horizontal scale of 1:250,000, the vertical exaggeration can be determined by dividing the horizontal scale by the vertical scale, yielding a factor of 3 (250,000 / 83,333 = 3). This 3:1 vertical exaggeration ensures that the map provides a visually engaging and accurate representation of the topography.

Accounting for the Human Perspective
The Role of Human Perception
A crucial aspect of cartography is the ability to translate the real world into a format that resonates with human perception. When creating maps, particularly raised relief 3D maps, cartographers must consider how people perceive and interact with geographical features. This process goes beyond technical accuracy; it involves a deep understanding of how scale and elevation are perceived by the human eye and mind.
For instance, while the actual elevations and distances might be accurately represented on a map, if these elements don’t align with our innate sense of scale, the map can feel off or misleading. When we look at a mountain range, we expect to see significant peaks and valleys. A map that flattens these features to the point of near invisibility fails to communicate the true nature of the terrain.
Cartographic Judgment
Cartographic judgment involves making informed decisions about how best to represent geographical features. This judgment balances the need for visual clarity with the goal of maintaining an accurate depiction of the terrain.
Experienced cartographers use their expertise to strike this balance, ensuring that our raised relief maps are both visually engaging and accurate representations of the terrain.
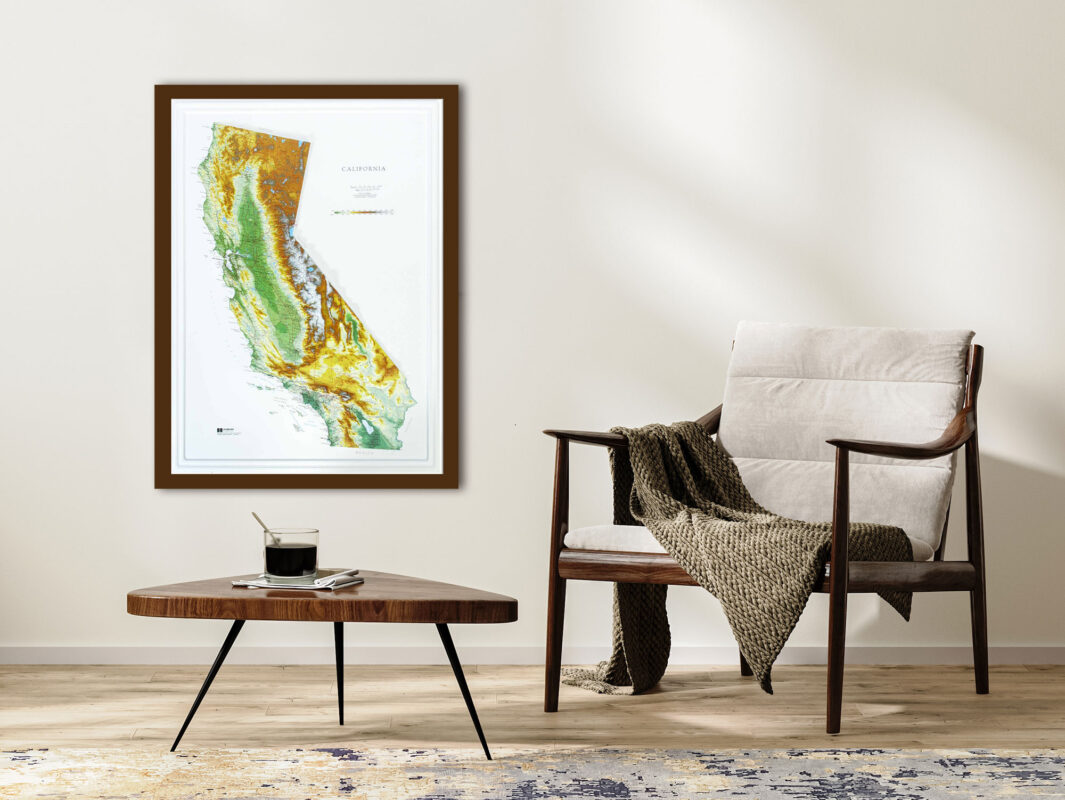
Bridging the Gap Between Science and Art
Cartography is often described as both a science and an art. The scientific aspect involves precise measurements, calculations, and the use of sophisticated tools and techniques. The artistic aspect, however, is where the human perspective comes into play. Cartographers must use their creative judgment to present information in a way that is visually compelling and intuitively understandable.
By incorporating vertical exaggeration and other techniques that cater to human perception, cartographers bridge the gap between these two disciplines. They transform raw data into a form that not only informs but also captivates. This balance between science and art is what makes raised relief 3D maps such powerful tools for education, exploration, and appreciation of the world’s diverse landscapes.
Practical Applications
Understanding the human perspective is also vital for practical applications of maps. For example, hikers and outdoor enthusiasts rely on raised relief maps to plan their routes and understand the terrain they will encounter. A map that accurately depicts elevation changes helps these users anticipate challenges and navigate safely.
Similarly, educators use raised relief maps to teach students about geography and topography. By presenting the information in a way that aligns with students’ perceptions, teachers can foster a deeper understanding and appreciation of the natural world.
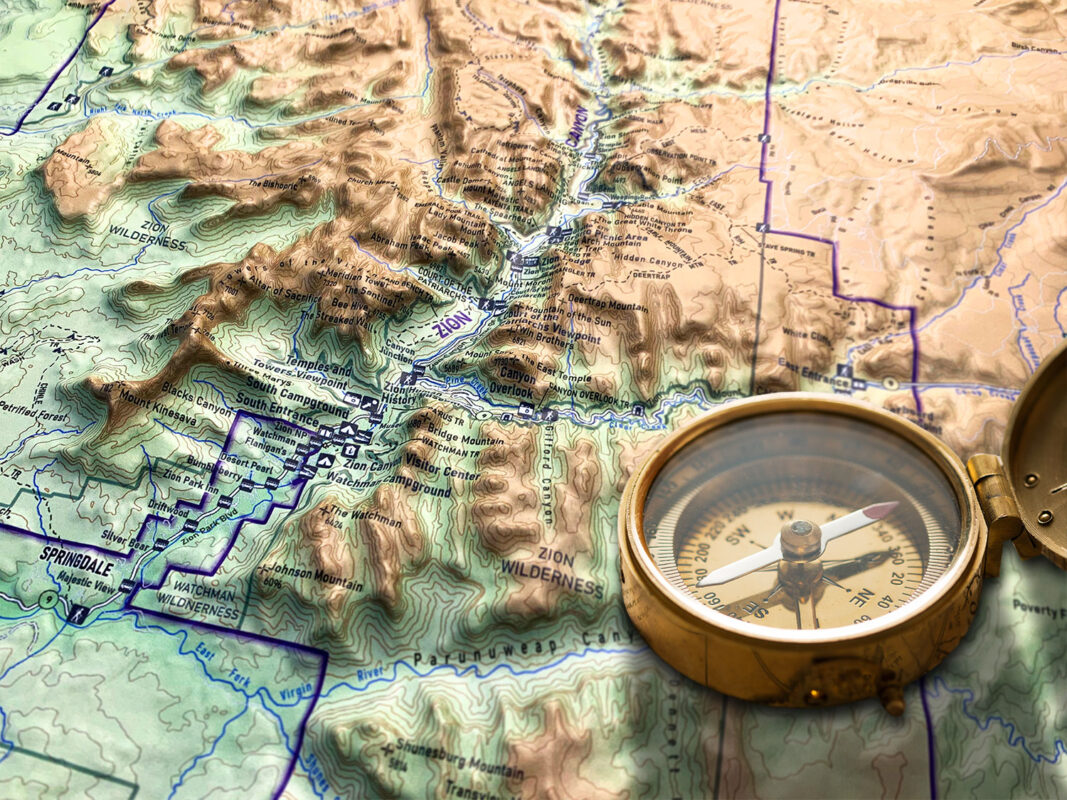
Raised relief 3D maps are a fascinating blend of art and science, requiring careful consideration of scale to provide an accurate and engaging representation of geographical features. By understanding the necessity of vertical exaggeration, the differences between horizontal and vertical scales, and the factors influencing these scales, we can appreciate the intricacies involved in creating these maps.
Whether you’re exploring the towering peaks of the Himalayas or the rolling hills at the base of the Appalachians, our raised relief maps offer a unique and informative perspective on the world’s diverse terrains. Through careful design and expert cartography, we bring these landscapes to life, ensuring that they resonate with our human perception of scale and grandeur.
